
Litecoin price is up over 10% and trading above $105 against the US Dollar. LTC could continue to rise toward the $120 resistance zone in the near term.
- Litecoin is showing positive signs from the $95 support zone against the US Dollar.
- The price is now trading above $105 and the 100 simple moving average (4 hours).
- There is a key bullish trend line forming with support at $101.50 on the 4-hour chart of the LTC/USD pair (data feed from Kraken).
- The price could continue to rise toward the $120 level unless it breaks the $100 support.
Litecoin Price Gains Bullish Momentum
In the past couple of days, Litecoin gained pace and outperformed Bitcoin and Ethereum. LTC price formed a base above the $80 level and started a decent increase.
There was a break above the $88 and $95 resistance levels. The bulls even pushed the price above $100. There was a clear move above the 76.4% Fib retracement level of the downward move from the $105.71 swing high to the $77.00 low. A new multi-week high was formed at $112.49 and the price is now consolidating gains.
top near $68.40 before it started a fresh decline.
Litecoin is now trading above $10 and the 100 simple moving average (4 hours). There is also a key bullish trend line forming with support at $101.50 on the 4-hour chart of the LTC/USD pair.
On the upside, immediate resistance is near the $112.50 zone. It is near the 1.236 Fib extension level of the downward move from the $105.71 swing high to the $77.00 low. The next major resistance is near the $115 level. If there is a clear break above the $115 resistance, the price could start another strong increase.
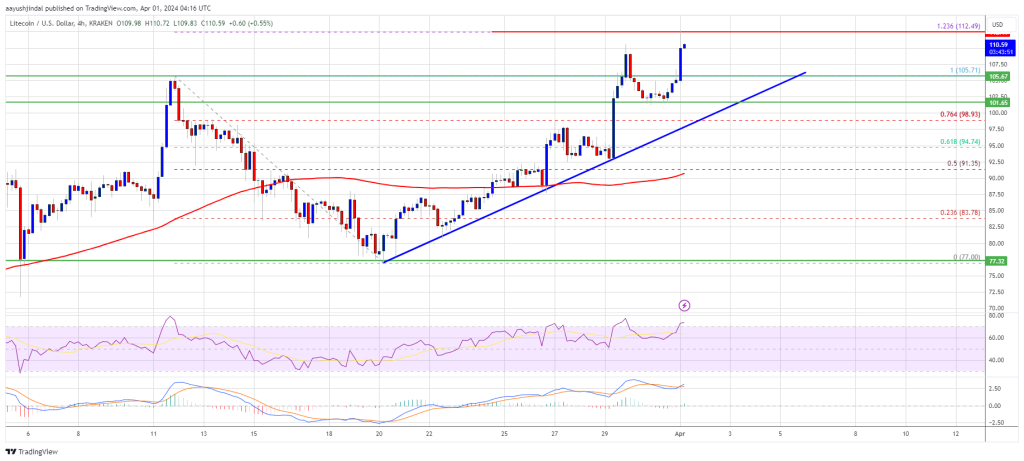
Source: LTCUSD on TradingView.com
In the stated case, the price is likely to continue higher toward the $120 and $122 levels. Any more gains might send LTC’s price toward the $132 resistance zone.
Are Dips Supported in LTC?
If Litecoin price fails to clear the $105 resistance level, there could be a downside correction. Initial support on the downside is near the $105 level.
The next major support is forming near the $100 level, below which there is a risk of a move toward the $95 support. Any further losses may perhaps send the price toward the $88 support.
Technical indicators:
4-hour MACD – The MACD is now gaining pace in the bullish zone.
4-hour RSI (Relative Strength Index) – The RSI for LTC/USD is above the 65 level.
Major Support Levels – $105 followed by $100.
Major Resistance Levels – $115 and $120.


